jen tarrant
designer • creative
Recently
Wealthsimple
Hive Brands
From the Archives
Hopper | Campaigns
Hopper | Company Events
Hopper | Pitches
Hopper | Data Viz
Hopper | Discovery Content
Hopper | Employee Cards
Hopper | Holiday Social
Care.com | Email
Joss & Main | Print
Joss & Main | Digital
Odds & Ends
Illustration
Pictures
Invitations
Logos
Edits
Resume
data visualizations at hopper
data visualizations
|
layout
|
infographics
2017 - 2020
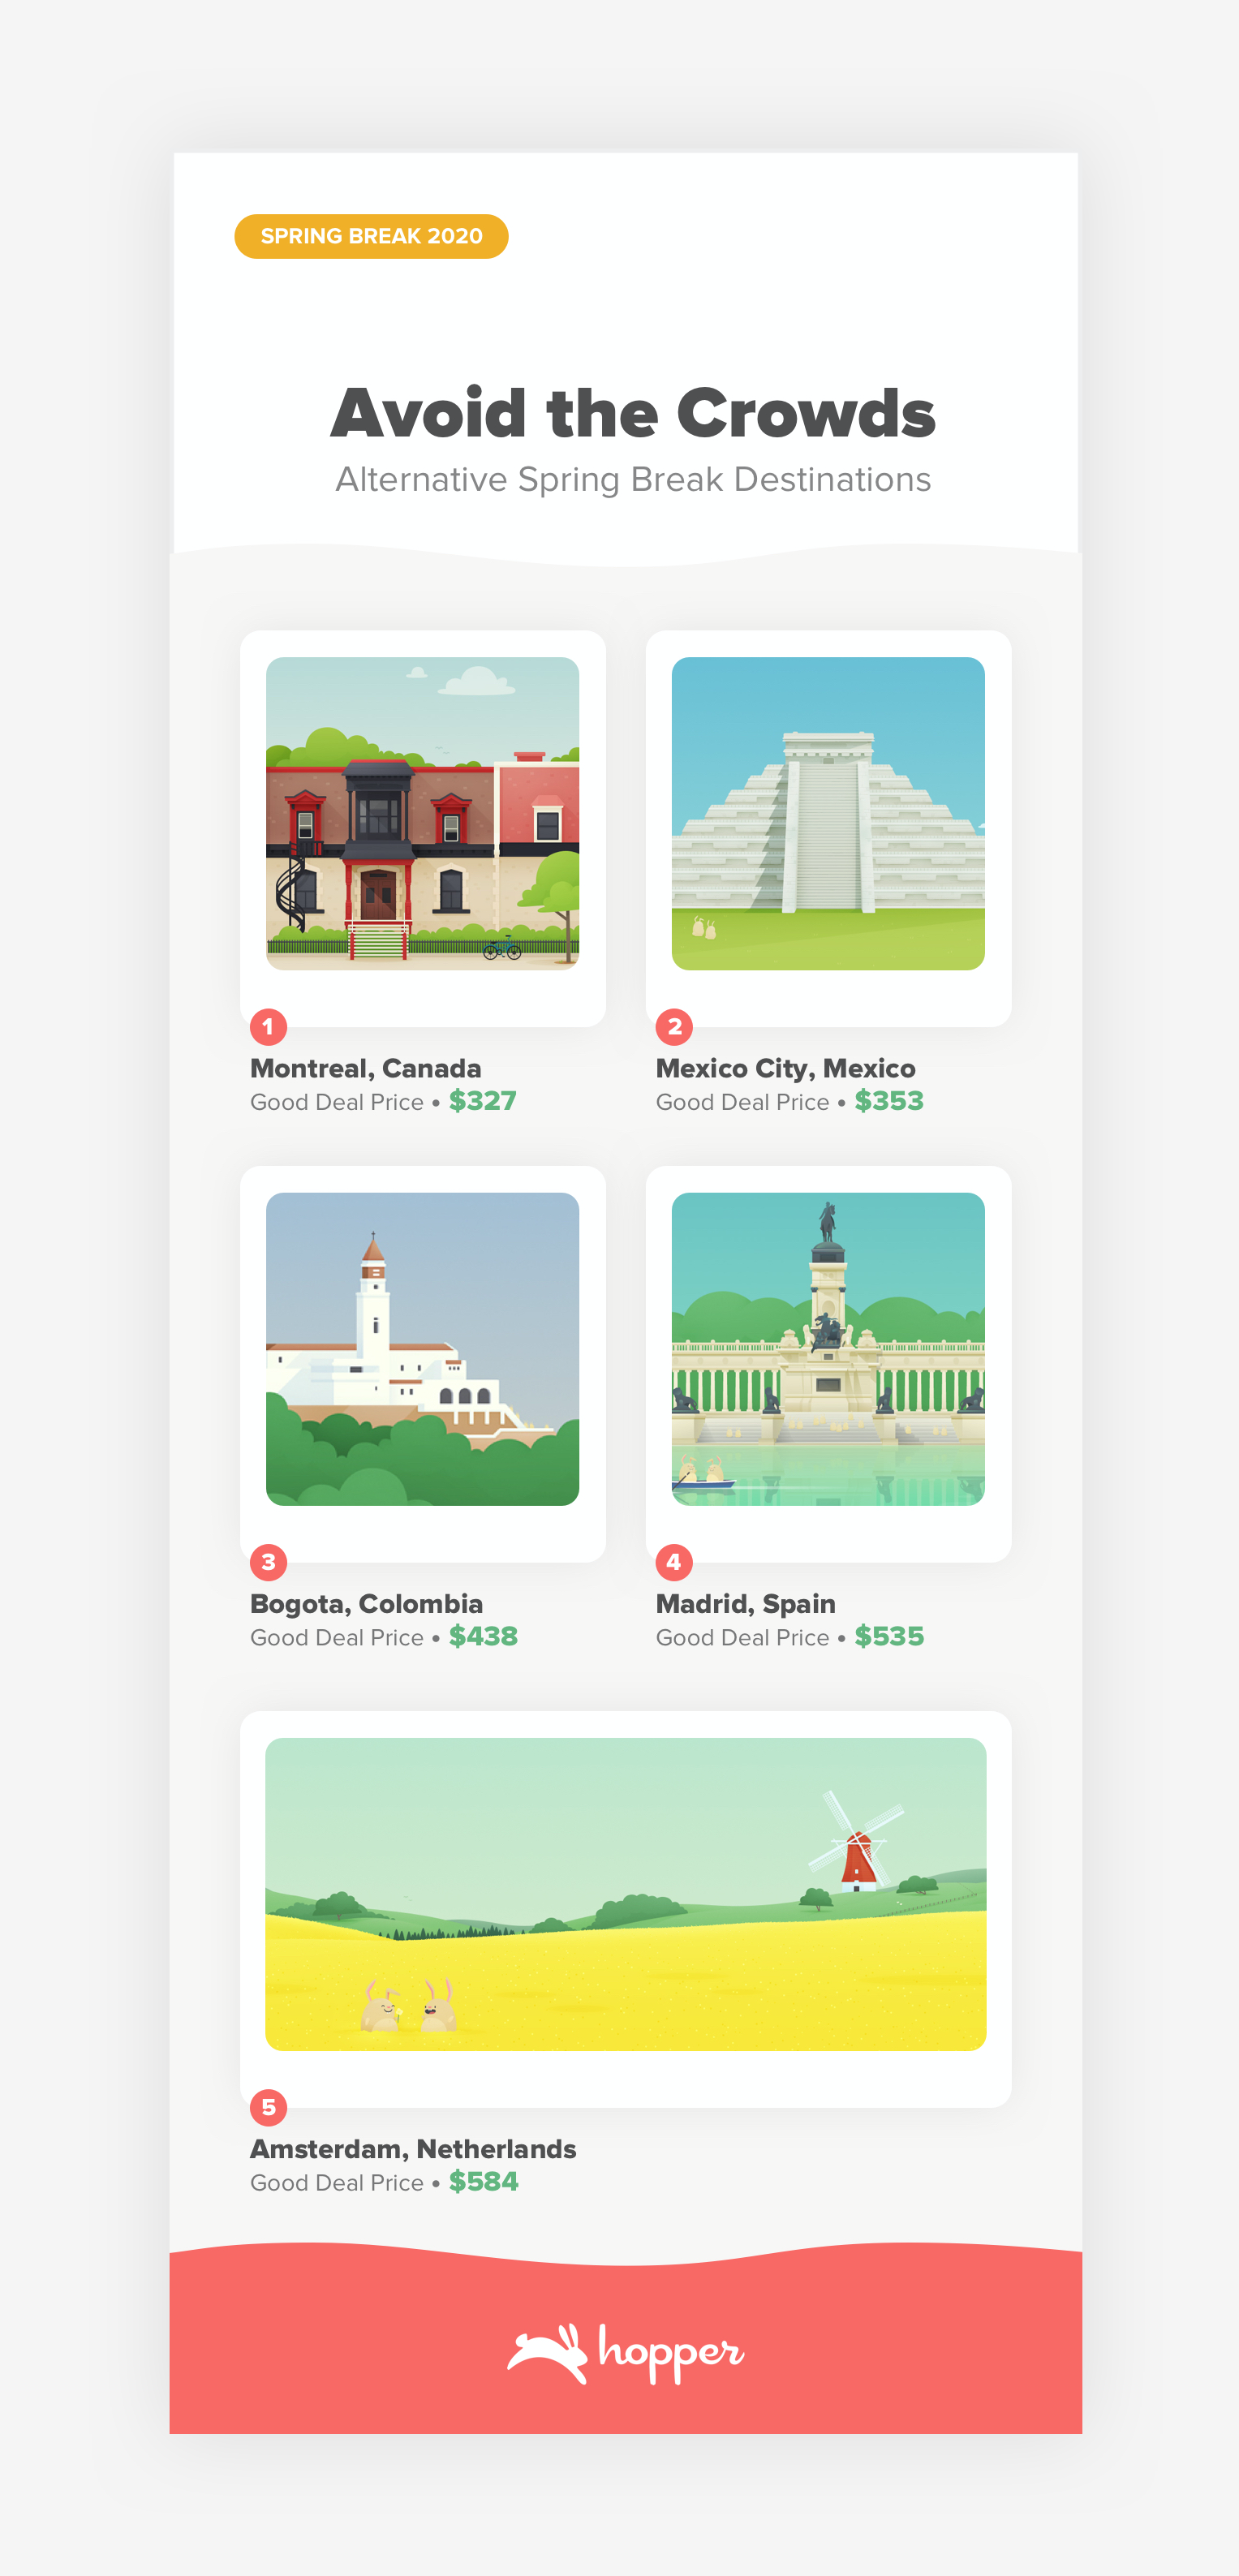
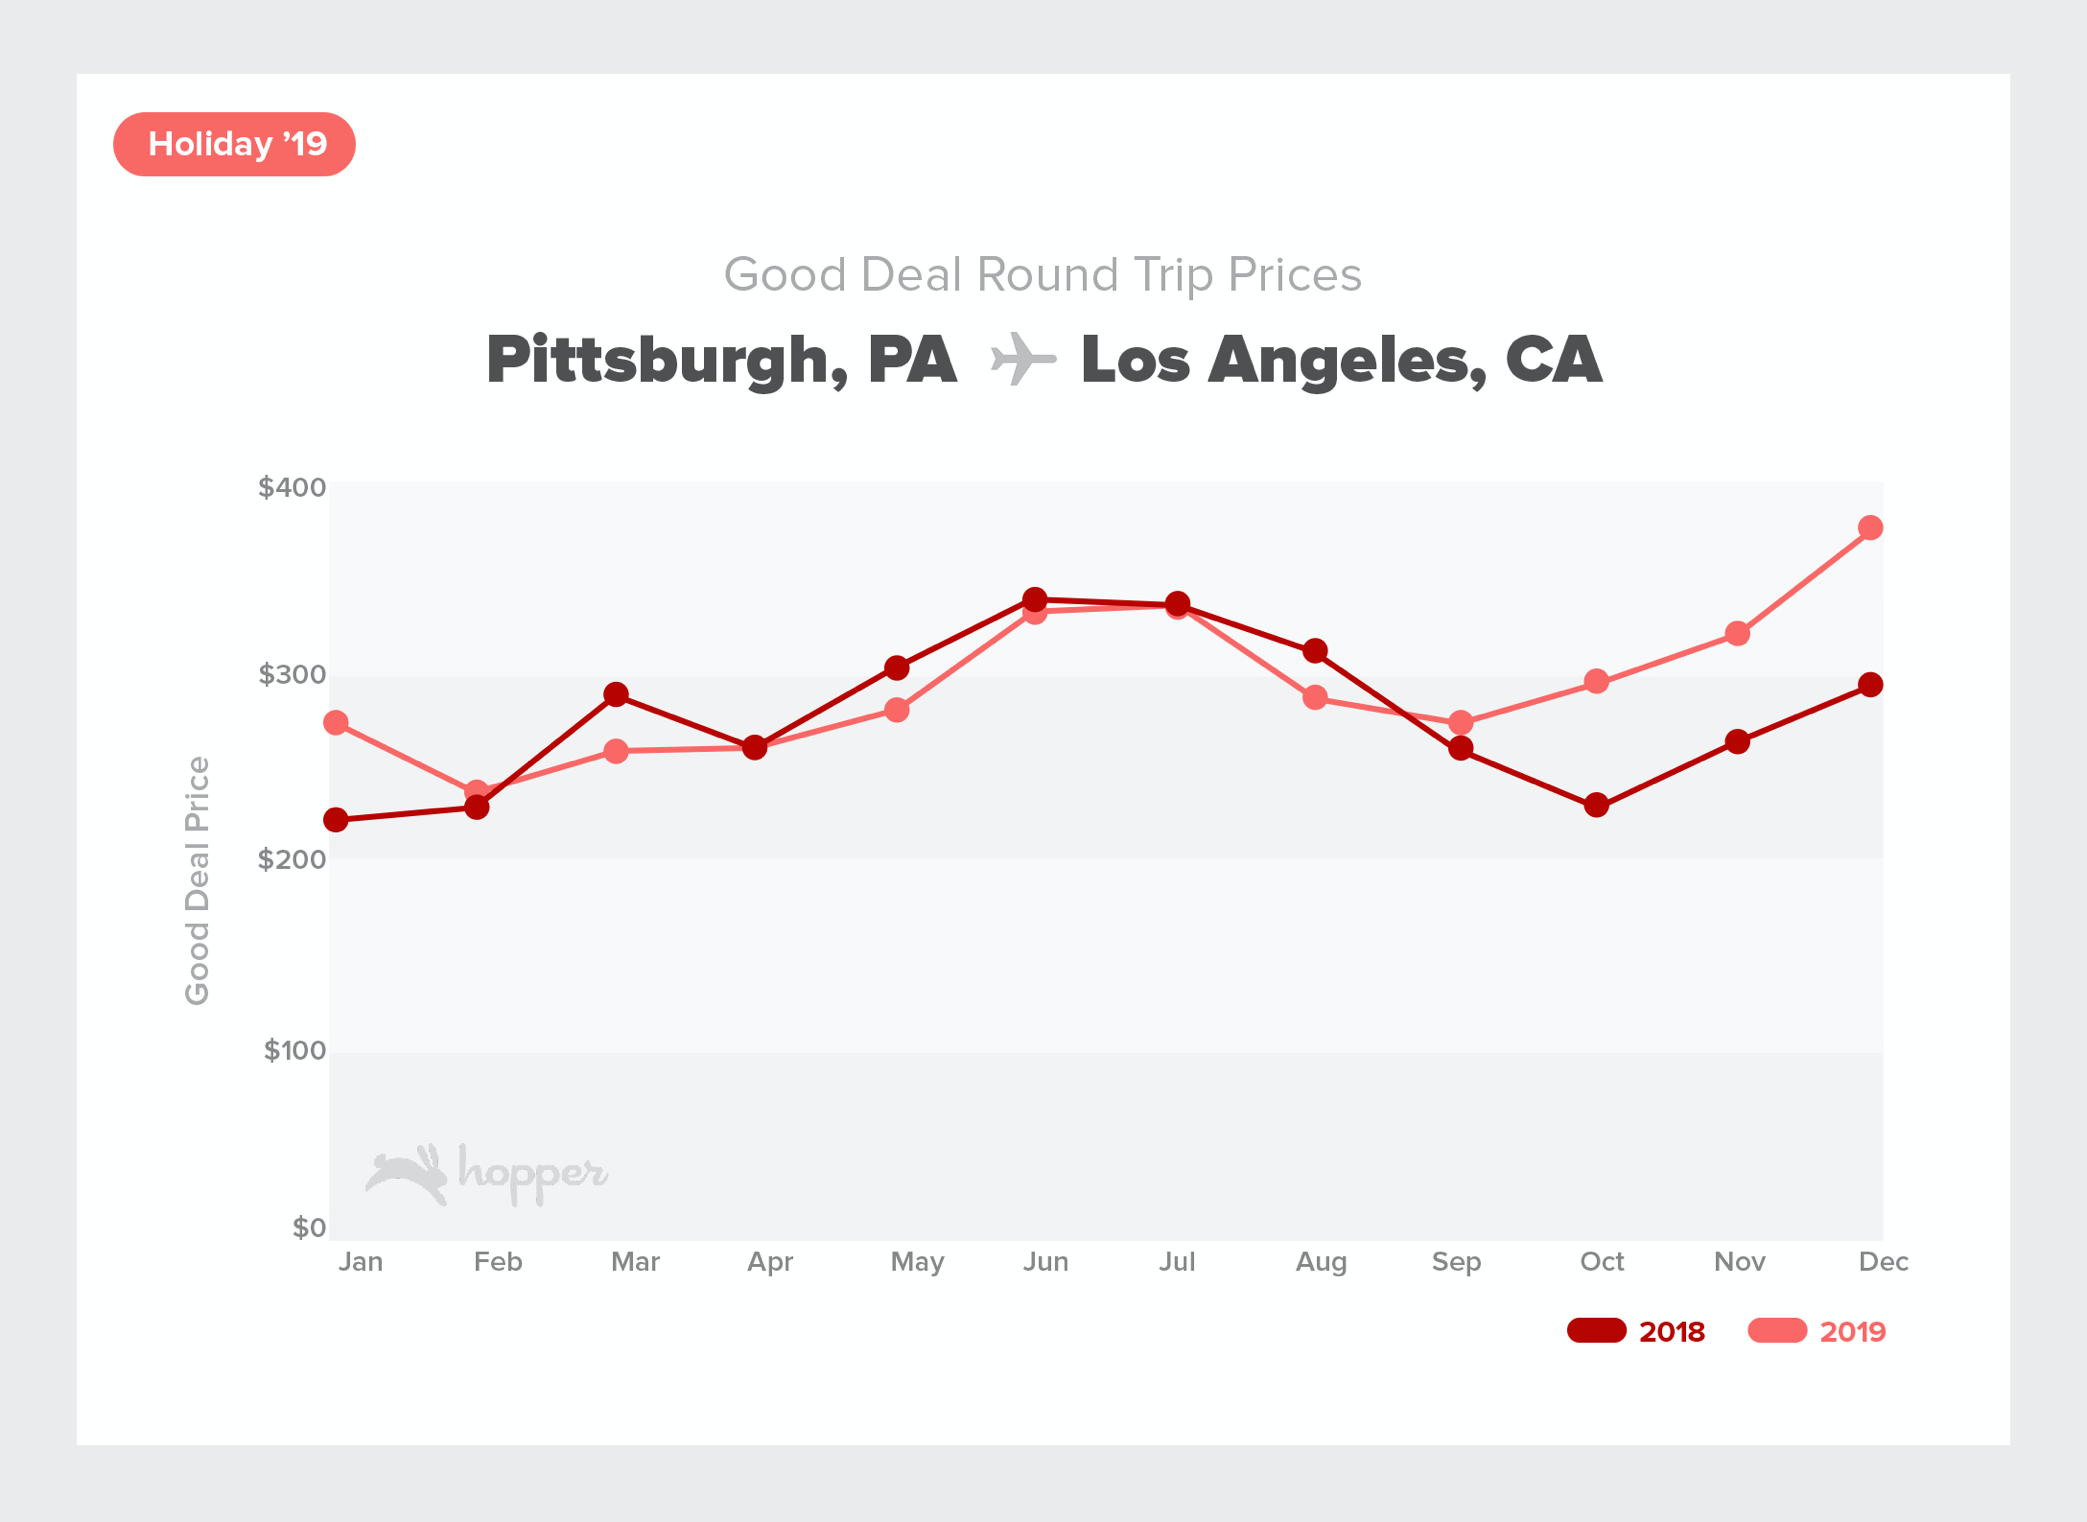
Hopper is built on data and I produced the visuals for press pitches, presentations, media kits, and more.
Hopper’s PR and data science teams often published seasonal content. I made sure each study was a good representation of our brand.
Sometimes I was tasked with taking really complex data and simplifying it into something the average person could understand.